1
I started with medication adherence data for a single user. The data included a medication schedule for two different prescriptions, the time the medications were actually taken, and a marker when the medication was skipped.
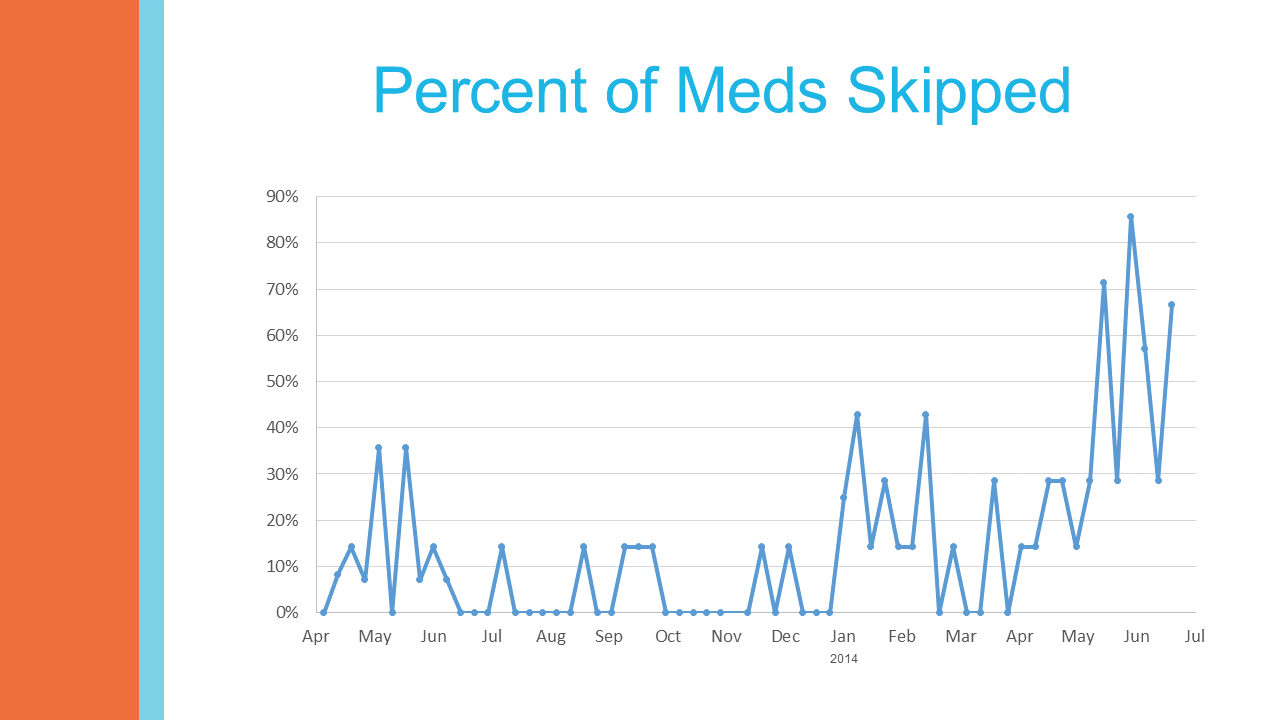
The medications skipped visualization tells a story about the user. The user started off with a high percentage of skips in the first couple months then fell into a routine with fewer skips for a while. As the user approached the one-year mark on the medication, s/he began skipping more-- skips went from an average of 6% in 2013 to 28% in 2014.
The data show there could be an opportunity to help the user get into a routine with her/his medication schedule. Then over time, as adherence drops, the user needs to be re-engaged and may require extra incentives and reminders.
See more data visuals from this project here.